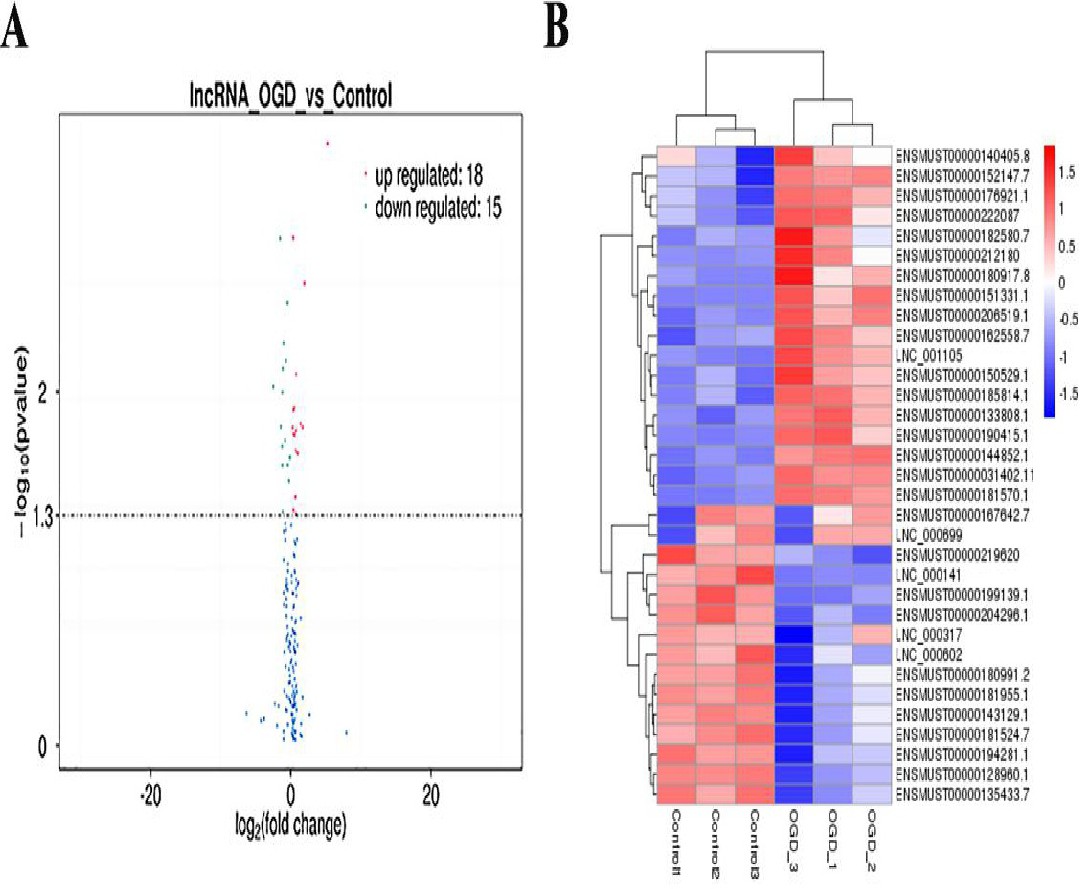
Fig. 4. Differentially expressed lncRNAs were exhibited by volcanoplot and clustering analysis. (A) A volcano plot of the differentially expressed lncRNAs between the control and OGD/R groups. (B) Heatmap and hierarchical clustering analyses of the 33 differentially expressed lncRNAs. The expression values are represented in shades of red and blue, indicating expression above and below the median value, respectively, across all samples.